Mastering RSD Calculation in Excel: A Comprehensive Guide

-
Quick Links:
- Introduction
- What is RSD?
- Why Use RSD?
- Step-by-Step Guide to Calculate RSD in Excel
- Case Studies
- Common Errors in RSD Calculation
- Best Practices for Using RSD
- Expert Insights
- Conclusion
- FAQs
Introduction
Relative Standard Deviation (RSD) is a statistical measure used to quantify the variability of a dataset relative to its mean. In Excel, calculating RSD is straightforward yet critical for data analysis in various fields such as finance, science, and engineering. This guide will delve into the concept of RSD, why it's essential, and how to calculate it using Excel, complete with practical examples and case studies.
What is RSD?
Relative Standard Deviation (RSD) is defined as the ratio of the standard deviation to the mean, expressed as a percentage. It is a useful tool for comparing the degree of variation between datasets with different units or widely different means.
The formula for RSD is:
RSD (%) = (Standard Deviation / Mean) × 100
Why Use RSD?
RSD is favored in data analysis for several reasons:
- Comparative Analysis: RSD allows for the comparison of variability across different datasets.
- Normalization: It normalizes the standard deviation relative to the mean, making it easier to interpret.
- Data Quality Assessment: High RSD values indicate more variability, which can signal issues in data quality.
Step-by-Step Guide to Calculate RSD in Excel
1. Gather Your Data
Before you start, ensure you have your dataset ready. This can be a list of values in a single column or row.
2. Open Excel and Input Data
Launch Excel and input your data into a single column. For example:
| Data |
|---|
| 10 |
| 12 |
| 15 |
| 8 |
| 14 |
3. Calculate the Mean
In a new cell, use the following formula to calculate the mean:
=AVERAGE(A2:A6)
4. Calculate the Standard Deviation
In another new cell, calculate the standard deviation using:
=STDEV.P(A2:A6)
This formula calculates the population standard deviation. If your data represents a sample, use STDEV.S instead.
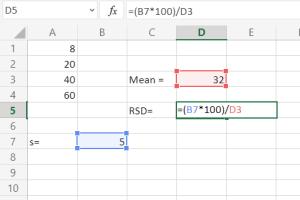
5. Calculate RSD
Now that you have both the mean and standard deviation, you can calculate RSD. In a new cell, enter:
= (STDEV.P(A2:A6) / AVERAGE(A2:A6)) * 100
This will give you the RSD value as a percentage.
Case Studies
Case Study 1: Laboratory Analysis
In laboratory settings, RSD is often used to assess the precision of measurements. For instance, if a lab conducts multiple tests on a particular sample, a low RSD indicates that the measurements are consistent, while a high RSD suggests variability that could compromise results.
Case Study 2: Financial Analysis
In finance, RSD can help investors understand the volatility of different stocks. For example, if Stock A has a much higher RSD than Stock B, it indicates that Stock A's price fluctuates more significantly compared to its average price, which can influence investment decisions.
Common Errors in RSD Calculation
- Using the wrong standard deviation formula (population vs. sample).
- Forgetting to convert to a percentage.
- Handling empty cells or non-numeric data incorrectly, which can skew results.
Best Practices for Using RSD
- Always check your data for outliers before calculating RSD.
- Use RSD in conjunction with other statistical measures for comprehensive analysis.
- Document your methods and calculations for transparency.
Expert Insights
Experts suggest that while RSD is a powerful tool, it should not be the sole measure of variability. Combining RSD with measures like interquartile range or confidence intervals can provide deeper insights.
Conclusion
Calculating RSD in Excel is a straightforward process that can greatly enhance your data analysis capabilities. Understanding RSD allows you to make informed decisions based on the variability of your data. With the steps outlined in this guide, you can confidently calculate RSD and apply it to various fields.
FAQs
- 1. What does RSD stand for?
- RSD stands for Relative Standard Deviation.
- 2. Why is RSD important?
- RSD helps assess the variability of data relative to its mean, making it easier to compare different datasets.
- 3. How is RSD calculated in Excel?
- RSD is calculated using the formula: (Standard Deviation / Mean) × 100 in Excel.
- 4. What is the difference between STDEV.P and STDEV.S?
- STDEV.P is used for population data, while STDEV.S is for sample data.
- 5. Can RSD be used for any dataset?
- RSD is best used for datasets where the mean is not close to zero, as it can be misleading.
- 6. What are the limitations of RSD?
- RSD can be affected by outliers and is sensitive to the mean; therefore, it may not always represent the variability accurately.
- 7. Is RSD the same as CV?
- Yes, RSD is often referred to as the Coefficient of Variation (CV).
- 8. Can RSD be negative?
- No, RSD cannot be negative as it is a ratio of standard deviation to mean, both of which are non-negative.
- 9. How does sample size affect RSD?
- Smaller sample sizes may lead to higher variability in RSD results, making them less reliable.
- 10. Can Excel handle large datasets for RSD calculations?
- Yes, Excel can handle large datasets, but performance may vary depending on your system's capabilities.
For more information on RSD and data analysis, check out these external resources:
- Statistics How To: Relative Standard Deviation
- NCBI: Statistical Methods in Medical Research
- Excel Easy: Standard Deviation
Random Reads
- Mastering league of legends windowed mode
- How to get an asin number on amazon
- How to find deleted apps on iphone
- How to find ender dragon
- Easy ways to turn off speakerphone
- How to draw a pie chart from percentages
- How to drill ceramic tile
- Fix corrupted powerpoint pptx
- Fix broken zipper
- Fix broken sd card lock