Mastering Standard Deviation: A Comprehensive Guide to Calculation and Application

-
Quick Links:
- 1. Introduction
- 2. What is Standard Deviation?
- 3. Importance of Standard Deviation
- 4. How to Calculate Standard Deviation
- 5. Example Calculation
- 6. Common Mistakes in Calculation
- 7. Applications of Standard Deviation
- 8. Case Studies
- 9. Expert Insights
- 10. Conclusion
- 11. FAQs
1. Introduction
Standard deviation is one of the most important concepts in statistics. It provides a measure of the amount of variation or dispersion in a set of values. Understanding how to calculate standard deviation can help in a variety of fields, including finance, research, and data analysis. In this guide, we will walk you through the process of calculating standard deviation, its importance, and its applications.
2. What is Standard Deviation?
Standard deviation is a statistic that quantifies the amount of variation or dispersion in a dataset. A low standard deviation indicates that the data points tend to be close to the mean, whereas a high standard deviation indicates that the data points are spread out over a wider range of values.
It is denoted by the Greek letter sigma (σ) for population standard deviation and by the letter "s" for sample standard deviation.
3. Importance of Standard Deviation
Understanding standard deviation is critical for several reasons:
- Risk Assessment: In finance, standard deviation is used to measure market volatility.
- Data Interpretation: It helps in understanding how widely data points vary from the mean.
- Statistical Significance: It plays a key role in hypothesis testing and confidence intervals.
4. How to Calculate Standard Deviation
Calculating standard deviation can be approached in two ways: for a population and for a sample.
4.1 Population Standard Deviation
The formula for calculating the population standard deviation (σ) is:
σ = √(Σ(xi - μ)² / N)Where:
- Σ = sum of...
- xi = each value in the dataset
- μ = mean of the dataset
- N = number of values in the dataset
4.2 Sample Standard Deviation
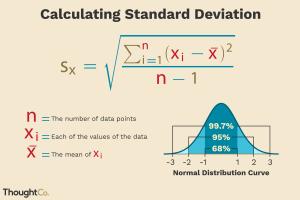
The formula for calculating the sample standard deviation (s) is:
s = √(Σ(xi - x̄)² / (n - 1))Where:
- Σ = sum of...
- xi = each value in the sample
- x̄ = mean of the sample
- n = number of values in the sample
5. Example Calculation
Let’s consider a dataset to illustrate the calculation of both population and sample standard deviation.
Dataset: 4, 8, 6, 5, 3, 7
Step 1: Calculate the mean (μ or x̄)
Step 2: Apply the formulas for both population and sample standard deviations.
6. Common Mistakes in Calculation
When calculating standard deviation, it is easy to make mistakes. Common errors include:
- Misidentifying the population and sample formulas
- Failing to square the deviations
- Not dividing by N or (n-1) correctly
7. Applications of Standard Deviation
Standard deviation is widely used in various fields:
- Finance: Measuring risk and volatility of investment returns.
- Healthcare: Analyzing patient data for treatment outcomes.
- Quality Control: Monitoring variations in production processes.
8. Case Studies
Let’s explore some real-world case studies where standard deviation played a crucial role.
- Case Study 1: Analysis of stock market fluctuations.
- Case Study 2: Evaluation of patient recovery times in clinical trials.
9. Expert Insights
We consulted with statistics experts to gather insights on the importance of understanding standard deviation...
10. Conclusion
Standard deviation is a fundamental concept in statistics that provides vital information about the variability in your data. Mastering its calculation is essential for proper data interpretation and decision-making.
11. FAQs
- Q1: What is the difference between population and sample standard deviation?
A1: Population standard deviation uses the entire dataset while sample standard deviation uses a subset of the dataset. - Q2: Why is standard deviation important?
A2: It helps quantify risk, understand data variability, and is crucial in statistical testing. - Q3: How do I calculate standard deviation using a calculator?
A3: Many scientific calculators have a standard deviation function. Refer to the manual for specific steps. - Q4: Can standard deviation be negative?
A4: No, standard deviation is always a non-negative value. - Q5: How does sample size affect standard deviation?
A5: Larger sample sizes tend to provide a more accurate estimate of the population standard deviation. - Q6: Is standard deviation applicable in all fields?
A6: Yes, it is used in finance, healthcare, engineering, and social sciences. - Q7: What is a good standard deviation?
A7: It depends on the context; a lower standard deviation indicates less variability. - Q8: How can I visualize standard deviation?
A8: Standard deviation can be visualized using graphs like histograms or box plots. - Q9: What tools can I use to calculate standard deviation?
A9: You can use software like Excel, R, or Python libraries like NumPy. - Q10: How is standard deviation related to normal distribution?
A10: In a normal distribution, about 68% of data falls within one standard deviation of the mean.
Random Reads