Mastering the Interquartile Range: A Comprehensive Guide to Finding the IQR

-
Quick Links:
- Introduction
- Understanding the Interquartile Range (IQR)
- Importance of the IQR in Statistics
- How to Calculate the IQR: Step-by-Step Guide
- Examples and Case Studies
- Common Mistakes When Finding the IQR
- Real-World Applications of the IQR
- Exploring Related Concepts: Quartiles and Outliers
- FAQs
Introduction
The Interquartile Range (IQR) is a key statistical measure that helps in understanding the spread and variability of data. In this comprehensive guide, we will explore what the IQR is, why it is important, and how you can easily find it in various datasets. Whether you're a student, data analyst, or just someone interested in statistics, this article will equip you with the knowledge and skills to master the IQR.
Understanding the Interquartile Range (IQR)
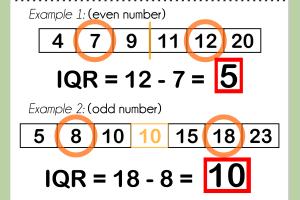
The IQR is defined as the difference between the third quartile (Q3) and the first quartile (Q1) of a data set. It measures the middle 50% of the data and is a robust measure of variability. The formula can be represented as:
IQR = Q3 - Q1
To better understand this, let's break down the concept of quartiles:
- First Quartile (Q1): The median of the first half of the dataset.
- Third Quartile (Q3): The median of the second half of the dataset.
Importance of the IQR in Statistics
The IQR is critical in several scenarios:
- Identifying Outliers: The IQR is used to detect outliers in data. Any data point that lies outside 1.5 times the IQR above Q3 or below Q1 is considered an outlier.
- Comparative Analysis: It allows comparison of variability between different datasets.
- Data Interpretation: Provides insights into the distribution of data, especially in box plots.
How to Calculate the IQR: Step-by-Step Guide
Calculating the IQR can be straightforward. Here’s a step-by-step guide:
Step 1: Organize Your Data
First, ensure your data set is organized in ascending order. For example:
5, 7, 8, 12, 13, 15, 18, 20, 21, 25Step 2: Find the Median
Next, determine the median of the dataset:
- If the number of observations (n) is odd, the median is the middle number.
- If n is even, the median is the average of the two middle numbers.
Step 3: Divide the Data into Two Halves
Split the data into two halves:
- Lower half: All values below the median.
- Upper half: All values above the median.
Step 4: Calculate Q1 and Q3
Now calculate Q1 and Q3:
- Q1: The median of the lower half.
- Q3: The median of the upper half.
Step 5: Compute the IQR
Finally, use the IQR formula:
IQR = Q3 - Q1
Examples and Case Studies
To solidify understanding, let’s go through a few examples:
Example 1: Simple Numeric Dataset
Consider the dataset: 3, 7, 8, 12, 14, 18, 21.
- Ordered Data:
3, 7, 8, 12, 14, 18, 21 - Median: 12
- Lower Half:
3, 7, 8(Q1 = 7) - Upper Half:
14, 18, 21(Q3 = 18) - IQR = 18 - 7 = 11
Example 2: Real-World Case Study
A case study involving test scores in a class:
Scores: 55, 67, 70, 75, 80, 82, 90, 95, 99
In this scenario, the IQR helps the teacher understand the spread of student performance:
- Ordered Data:
55, 67, 70, 75, 80, 82, 90, 95, 99 - Median: 80
- Lower Half:
55, 67, 70, 75(Q1 = 70) - Upper Half:
82, 90, 95, 99(Q3 = 90) - IQR = 90 - 70 = 20
Common Mistakes When Finding the IQR
- Ignoring Data Order: Ensure your dataset is in ascending order before calculating.
- Miscalculating Quartiles: Remember to find the median of the appropriate halves.
- Confusing IQR with Range: The IQR measures variability within the middle 50%, while range measures the total spread.
Real-World Applications of the IQR
The IQR has various applications, including:
- Finance: Assessing risk and return in investment portfolios.
- Healthcare: Analyzing patient data for better healthcare delivery.
- Education: Understanding student performance and addressing gaps.
Exploring Related Concepts: Quartiles and Outliers
Understanding quartiles is crucial to grasping the IQR:
- Quartiles: Divide the dataset into four equal parts.
- Outliers: Data points significantly different from others. Identified using IQR boundaries.
FAQs
- What is the IQR? The Interquartile Range measures the middle 50% of a dataset.
- How do you find Q1 and Q3? Q1 and Q3 are the medians of the lower half and upper half of the data, respectively.
- Why is the IQR important? It helps identify outliers and measures statistical dispersion.
- How can I use the IQR in Excel? Use the QUARTILE function to find Q1 and Q3, then subtract to get the IQR.
- Can the IQR be negative? No, the IQR cannot be negative as it is a measure of distance between two quartiles.
- What is a good IQR value? A "good" IQR value depends on the context of the data being analyzed.
- How does the IQR compare to standard deviation? IQR is robust against outliers, while standard deviation is sensitive to them.
- Is IQR used in machine learning? Yes, it is often used in data preprocessing to handle outliers.
- How do box plots relate to IQR? Box plots visually represent the IQR and highlight outliers.
- Can IQR be used for categorical data? No, IQR is only applicable to continuous numerical data.
Random Reads
- How to solder electronics
- What video game should i play
- Whatsapp usage
- Mastering autocad scale designs
- How to open and use file manager android
- How to remove calcium from water
- How to remove burn marks on wood
- Simple steps to unlock disabled iphone
- Making small urls 11 tools to create shorter web links
- Unlock your nokia cell phone