Mastering Excel: How to Easily Highlight Every Other Row for Better Data Visualization

-
Quick Links:
- Introduction
- Why Highlight Every Other Row?
- Step-by-Step Guide to Highlighting Rows
- Case Studies
- Advanced Techniques
- Common Mistakes
- FAQs
- Conclusion
Introduction
Microsoft Excel is an essential tool for data analysis and management. One common technique to enhance the readability of data is to highlight every other row. This technique not only makes your data visually appealing but also helps in quick reference and analysis. In this article, we'll explore various methods to highlight alternating rows in Excel, focusing on step-by-step guides, expert insights, and real-world applications.
Why Highlight Every Other Row?
Highlighting every other row in Excel serves several purposes:
- Improved Readability: Alternating row colors make it easier for users to read large datasets.
- Data Analysis: Quick visual cues help in spotting trends and anomalies within the data.
- Professional Appearance: Well-formatted data looks more professional, enhancing presentations and reports.
Step-by-Step Guide to Highlighting Rows
Using Conditional Formatting
Conditional formatting is a powerful feature in Excel that allows you to apply specific formatting to cells based on their values. Here’s how to highlight every other row using this feature:
- Open your Excel Workbook: Launch Microsoft Excel and open your workbook.
- Select Your Data Range: Click and drag to highlight the range of cells you want to format.
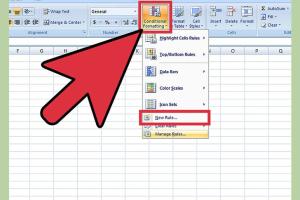
- Access Conditional Formatting: Navigate to the 'Home' tab on the ribbon, click on 'Conditional Formatting', and select 'New Rule'.
- Use a Formula to Determine Which Cells to Format: In the dialog box, select 'Use a formula to determine which cells to format'.
- Enter the Formula: Type in the formula:
=ISEVEN(ROW())to highlight even rows. For odd rows, use=ISODD(ROW()). - Choose Your Formatting: Click on the 'Format' button, choose your desired fill color, and hit OK.
- Finalize the Rule: Click OK again to apply the rule.
Formatting Options
Excel provides various formatting options for highlighting rows. Here are some popular choices:
- Fill Color: Choose a light color to avoid overpowering the text.
- Font Style: Adjusting the font style or size can enhance visibility.
- Border Styles: Adding borders can further separate the rows visually.
Case Studies
1. Financial Reporting
In financial reports, highlighting every other row can help analysts quickly compare figures across rows. For instance, a quarterly financial statement can benefit from this formatting, making the data more accessible to stakeholders.
2. Project Management
For project management tracking, alternating row colors can help team members quickly identify tasks and their statuses, fostering better clarity and communication.
Advanced Techniques
Once you have mastered the basics, you can explore more advanced techniques such as:
- Custom Formulas: Create complex formulas to highlight based on multiple conditions.
- Dynamic Ranges: Use named ranges or tables to ensure your formatting applies even when you add new data.
Common Mistakes
Avoid these common pitfalls when highlighting rows:
- Using Dark Colors: Dark colors can make text hard to read.
- Ignoring Headers: Always ensure your header row is not included in the formatting.
- Overcomplicating Rules: Keep it simple; too many conditions can confuse users.
FAQs
- Can I highlight every other column as well?
Yes, you can use similar conditional formatting rules to highlight alternating columns. - Will this formatting change if I add new rows?
If you use a table, the formatting will automatically apply to new rows. - Can I use different colors for odd and even rows?
Yes, you can create two separate rules for odd and even rows using different colors. - Is this feature available in all versions of Excel?
Yes, conditional formatting is available in all modern versions of Excel. - Can I apply this to filtered data?
Yes, but you may need to adjust your rules to ensure they apply correctly to visible cells. - What if I want to highlight specific rows based on criteria?
You can create conditional formatting rules based on cell values or other criteria. - How do I remove the highlighting?
You can manage rules in the 'Conditional Formatting' menu and delete or modify existing rules. - Can I copy the format to other sheets?
Yes, you can use the Format Painter tool to copy formatting to other sheets. - Does highlighting rows impact performance?
Generally, no. However, very large datasets may experience slight performance issues with complex rules. - Is there a way to automate this process?
You can use VBA (Visual Basic for Applications) for more automation in Excel.
Conclusion
Highlighting every other row in Microsoft Excel is a simple yet effective way to enhance data readability and analysis. With the step-by-step guide and the insights provided, you can easily implement this technique to make your spreadsheets more professional and user-friendly. Experiment with different formatting options to find the best fit for your data presentation needs.
Random Reads