Mastering Pivot Tables: A Comprehensive Guide to Adding Rows

-
Quick Links:
- Introduction
- Understanding Pivot Tables
- Why Add Rows to Pivot Tables?
- How to Add Rows to Pivot Tables
- Advanced Row Addition Techniques
- Case Studies
- Common Issues and How to Solve Them
- Expert Insights
- Conclusion
- FAQs
Introduction
In the realm of data analysis, pivot tables stand out as a powerful tool for summarizing and visualizing complex datasets. With the ability to reorganize and analyze data efficiently, pivot tables are indispensable for professionals in various fields. However, knowing how to effectively manipulate these tables, such as adding rows, can significantly enhance your analytical capabilities.
Understanding Pivot Tables
Pivot tables are a data processing feature in Excel and other spreadsheet applications that allow users to automatically sort, count, and total data stored in one table or spreadsheet. They enable users to extract significant insights from large datasets quickly.
Key Features of Pivot Tables
- Data Summarization: Quickly summarize large amounts of data.
- Dynamic Reporting: Create reports that can be updated automatically.
- Data Analysis: Analyze trends and patterns in data.
- Flexibility: Rearrange and filter data easily.
Why Add Rows to Pivot Tables?
Adding rows to a pivot table allows for a more detailed view of the data being analyzed. This can help in various ways:
- Enhanced Detail: Break down data into more specific categories.
- Improved Insights: Identify trends that may be obscured in summary views.
- Custom Analysis: Tailor the data presentation to meet the needs of specific stakeholders.
How to Add Rows to Pivot Tables
Adding rows in a pivot table can be done through several methods, depending on the specific needs of your data analysis. Below is a comprehensive, step-by-step guide to adding rows:
Step 1: Prepare Your Data
Ensure your data is well-organized. Each column should represent a different variable, and each row should represent a different record.
Step 2: Insert a Pivot Table
- Select the data range.
- Go to the Insert tab in Excel.
- Click on PivotTable.
- Choose where you want the pivot table to be placed.
Step 3: Adding Rows
To add rows to your pivot table:
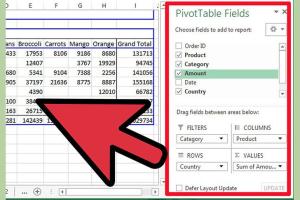
- In the PivotTable Field List, find the field you want to add as a row.
- Drag and drop this field into the Rows area.
- Your pivot table will automatically update to include this new row.
Advanced Row Addition Techniques
For users looking to maximize the potential of their pivot tables, consider the following advanced techniques:
Using Calculated Fields
Calculated fields allow you to create new data points derived from existing data. To add a calculated field:
- Click on the pivot table.
- Go to the PivotTable Analyze tab.
- Select Fields, Items & Sets, then Calculated Field.
- Enter your formula and click Add.
Grouping Data
Group data to create a more organized row structure. This can be particularly useful for dates or categories:
- Select the rows you want to group.
- Right-click and select Group.
Case Studies
Case Study 1: Retail Sales Analysis
A retail company utilized pivot tables to analyze sales data. By adding rows for different product categories, they identified which categories were underperforming and adjusted inventory accordingly.
Case Study 2: Employee Performance Tracking
An HR department used pivot tables to track employee performance metrics. By adding rows for individual employees, they were able to provide targeted feedback and improve overall productivity.
Common Issues and How to Solve Them
While working with pivot tables, users may encounter various issues. Here are some common problems and solutions:
Issue 1: Data Not Updating
If your pivot table isn’t updating, try refreshing it:
- Right-click on the pivot table.
- Select Refresh.
Issue 2: Missing Rows
If certain rows are missing, ensure that the data source includes all necessary information. Check the field settings as well.
Expert Insights
Experts in data analysis emphasize the importance of mastering pivot tables. According to industry leaders, understanding how to manipulate pivot tables effectively can drastically improve data-driven decision-making processes.
Conclusion
Adding rows to pivot tables is a powerful method to enhance your data analysis capabilities. By understanding how to navigate and utilize pivot tables effectively, you can unlock the full potential of your data.
FAQs
1. What are pivot tables used for?
Pivot tables are used for summarizing, analyzing, exploring, and presenting large amounts of data in a concise format.
2. Can I add multiple rows at once?
Yes, you can add multiple rows by dragging multiple fields into the Rows area in the pivot table field list.
3. What if my data changes frequently?
Pivot tables can be refreshed easily to reflect changes in your data source.
4. Are calculated fields compatible with all data types?
Calculated fields work with numerical data types. Ensure your data is formatted correctly for calculations.
5. Can I filter rows in a pivot table?
Yes, you can apply filters to rows in a pivot table to display only the data you want to analyze.
6. How do I remove a row from a pivot table?
Simply drag the field out of the Rows area in the PivotTable Field List.
7. Can I format my pivot table?
Yes, pivot tables can be formatted using the Design tab in Excel to enhance their visual appeal.
8. Is there a limit to the number of rows I can add?
While there is no strict limit, performance may degrade with very large datasets.
9. Can I create charts from pivot tables?
Yes, you can create various types of charts directly from pivot tables to visualize your data.
10. What versions of Excel support pivot tables?
Most modern versions of Excel, including Excel 2007 and later, support pivot tables.