Mastering Outliers: Comprehensive Guide to Calculating Outliers in Data Analysis

-
Quick Links:
- 1. Introduction
- 2. What Are Outliers?
- 3. Importance of Identifying Outliers
- 4. Methods of Calculating Outliers
- 5. Case Studies
- 6. Step-by-Step Guide to Calculate Outliers
- 7. Expert Insights
- 8. Common Mistakes in Outlier Detection
- 9. FAQs
1. Introduction
Outliers can significantly skew your data analysis results, leading to incorrect interpretations and conclusions. Therefore, understanding how to identify and calculate outliers is crucial for anyone involved in data analytics, statistics, or data-driven decision-making.
2. What Are Outliers?
Outliers are data points that differ significantly from other observations in a dataset. They can occur due to variability in the measurement or may indicate experimental errors. Outliers can be classified into three primary categories:
- **Global Outliers:** Points that are extreme compared to the overall dataset.
- **Contextual Outliers:** Points that are considered outliers only in a specific context.
- **Collective Outliers:** A group of points that are collectively abnormal.
3. Importance of Identifying Outliers
Identifying outliers is essential for several reasons:
- **Data Integrity:** Ensures the reliability and accuracy of your analysis.
- **Improved Decision Making:** Helps in making informed decisions based on accurate data.
- **Enhanced Model Performance:** Outliers can negatively impact the performance of statistical models.
4. Methods of Calculating Outliers
There are several effective methods for calculating outliers. The best method often depends on the distribution of your data and the specific context.
4.1 Z-Score Method
The Z-score method is a statistical technique that measures the distance of a data point from the mean in terms of standard deviations. Here’s how to use it:
- Calculate the mean (μ) and standard deviation (σ) of your dataset.
- Compute the Z-score for each data point using the formula: Z = (X - μ) / σ.
- Identify data points with a Z-score greater than +3 or less than -3 as outliers.
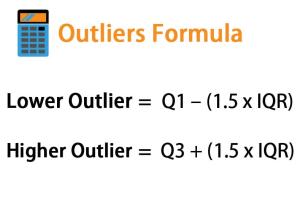
4.2 Interquartile Range (IQR) Method
The IQR method focuses on the middle 50% of the data, providing a robust way to identify outliers:
- Calculate the first quartile (Q1) and the third quartile (Q3).
- Determine the IQR: IQR = Q3 - Q1.
- Calculate the lower bound as Q1 - 1.5 * IQR and the upper bound as Q3 + 1.5 * IQR.
- Any data points outside these bounds are considered outliers.
4.3 Modified Z-Score Method
The modified Z-score method is a more robust alternative to the standard Z-score method, especially for datasets that are not normally distributed. To calculate:
- Calculate the median (M) and median absolute deviation (MAD) of your dataset.
- Use the formula: Modified Z = 0.6745 * (X - M) / MAD.
- Consider data points with a modified Z-score greater than 3.5 or less than -3.5 as outliers.
4.4 Visualization Techniques
Visualization can help identify outliers at a glance. Common techniques include:
- **Box Plots:** Visual representation displaying the median, quartiles, and potential outliers.
- **Scatter Plots:** Useful for visualizing the relationship between two variables and spotting outliers.
- **Histograms:** Provide insight into the data distribution and highlight unusual spikes or tails.
5. Case Studies
Case studies can provide real-world examples of how outlier detection is applied in various fields:
- **Finance:** Identifying fraudulent transactions.
- **Healthcare:** Spotting unusual patient outcomes in clinical trials.
- **Manufacturing:** Detecting defects in production lines.
6. Step-by-Step Guide to Calculate Outliers
To effectively calculate outliers in your dataset, follow these steps:
- Collect and clean your dataset to ensure accuracy.
- Choose the appropriate method for outlier detection based on your data distribution.
- Implement the selected method using software tools or programming languages like Python or R.
- Visualize the results to confirm the presence of outliers.
- Decide how to handle outliers: retain, remove, or adjust.
7. Expert Insights
Experts emphasize the importance of context when determining outliers. A data point may be an outlier in one scenario but not in another. Always consider the implications of removing outliers from your dataset.
8. Common Mistakes in Outlier Detection
Some common mistakes to avoid include:
- **Ignoring context:** Failing to consider the context can lead to removing valuable data.
- **Over-reliance on automated methods:** Always validate results with visual methods.
- **Not documenting decisions:** Keeping a record of your outlier handling process is crucial for transparency.
9. FAQs
1. What is an outlier?
An outlier is a data point that deviates significantly from the rest of the dataset.
2. Why are outliers important?
Outliers can distort statistical analyses and lead to inaccurate conclusions; identifying them is critical for data integrity.
3. How do I calculate outliers?
You can calculate outliers using methods like Z-score, IQR, and Modified Z-score.
4. What is the IQR method?
The IQR method identifies outliers by calculating the interquartile range and determining bounds for acceptable values.
5. How does the Z-score method work?
The Z-score method measures how many standard deviations a data point is from the mean.
6. Can outliers be useful?
Yes, outliers can provide insights into rare events or errors in data collection processes.
7. What software can I use to detect outliers?
Popular software includes Python (with libraries like pandas and NumPy), R, and various statistical tools like SPSS.
8. How should I handle outliers?
Handling outliers depends on your analysis goals; you can keep, remove, or adjust them based on their context and impact.
9. Are outliers always bad?
Not necessarily; they can indicate significant findings or errors, and their impact on analysis should be evaluated.
10. What are some visualization techniques for outliers?
Box plots, scatter plots, and histograms are effective visualization techniques for spotting outliers.
Random Reads