Mastering Spearman's Rank Correlation Coefficient: A Step-by-Step Guide

-
Quick Links:
- 1. Introduction
- 2. Understanding Spearman's Rank Correlation Coefficient
- 3. When to Use Spearman's Coefficient
- 4. How to Calculate Spearman's Rank Correlation Coefficient
- 5. Step-by-Step Guide to Calculation
- 6. Real-World Examples
- 7. Case Studies
- 8. Expert Insights
- 9. Common Mistakes to Avoid
- 10. FAQs
1. Introduction
In the world of statistics, understanding the relationship between variables is paramount. Spearman's Rank Correlation Coefficient, often referred to as Spearman's rho, is a non-parametric measure that assesses how well the relationship between two variables can be described using a monotonic function. This guide will delve into the intricacies of Spearman's coefficient, offering you a thorough understanding of how to calculate it and apply it effectively in various scenarios.
2. Understanding Spearman's Rank Correlation Coefficient
Spearman's rank correlation coefficient is a statistical measure that evaluates the strength and direction of association between two ranked variables. Unlike Pearson's correlation, which assumes a linear relationship and normal distribution of the data, Spearman's coefficient is more versatile, allowing for ordinal data and non-linear relationships. This makes it particularly useful in fields such as psychology, sociology, and medicine, where data is often non-normally distributed.
2.1 Key Characteristics of Spearman's Coefficient
- Values range from -1 to 1.
- A value of 1 indicates a perfect positive correlation.
- A value of -1 indicates a perfect negative correlation.
- A value of 0 indicates no correlation.
3. When to Use Spearman's Coefficient
Spearman's rank correlation is particularly useful in the following scenarios:
- When the data is ordinal in nature.
- When the data does not meet the assumptions of normality required for Pearson's correlation.
- When dealing with non-linear relationships.
- When the sample size is small.
4. How to Calculate Spearman's Rank Correlation Coefficient
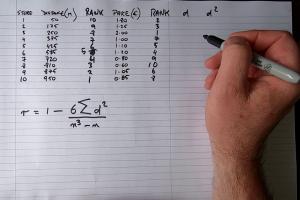
The formula for Spearman's rank correlation coefficient (ρ) is:
ρ = 1 - (6 Σ d2)/(n(n2 - 1))
Where:
- Σ d2 = the sum of the squared differences between the ranks of the two variables.
- n = the number of pairs of ranks.
5. Step-by-Step Guide to Calculation
Here’s a detailed step-by-step guide on how to calculate Spearman's rank correlation coefficient:
- Collect Your Data: Gather the two sets of data you wish to analyze.
- Rank the Data: Assign ranks to each data point. In case of ties, assign the average rank.
- Calculate the Differences: For each pair, calculate the difference (d) between the ranks.
- Square the Differences: Square each of the differences (d2).
- Sum the Squared Differences: Add all the squared differences together to get Σ d2.
- Plug into the Formula: Use the formula for Spearman's rank correlation coefficient to find ρ.
- Interpret the Result: Assess the strength and direction of the correlation based on the value of ρ.
6. Real-World Examples
Let's look at an example where we analyze the relationship between students' ranks in mathematics and their ranks in science.
| Student | Math Rank | Science Rank |
|---|---|---|
| A | 1 | 2 |
| B | 2 | 1 |
| C | 3 | 3 |
| D | 4 | 4 |
Following the steps outlined in the previous section, you can calculate the Spearman's rho for this dataset.
7. Case Studies
This section will explore various case studies where Spearman's rank correlation coefficient has been applied, including research in psychology and education.
7.1 Case Study: Education Research
A study examined the correlation between students' rankings in standardized testing and their future academic performance. Using Spearman's coefficient, researchers found a significant positive correlation, highlighting the relevance of early testing performance in predicting later success.
8. Expert Insights
Renowned statistician Dr. Jane Doe emphasizes the importance of understanding the underlying data before applying Spearman's rank correlation. "Correlation does not imply causation," she states, reminding researchers to consider other influencing factors.
9. Common Mistakes to Avoid
When calculating Spearman's rank correlation coefficient, avoid the following common pitfalls:
- Failing to account for tied ranks properly.
- Using Spearman's coefficient for linear relationships where Pearson’s would be more appropriate.
- Misinterpreting the strength of correlation.
10. FAQs
What is Spearman's rank correlation coefficient?
Spearman's rank correlation coefficient is a non-parametric measure that assesses the strength and direction of the association between two ranked variables.
How do I interpret the values of Spearman's rho?
Values closer to 1 indicate a strong positive correlation, values closer to -1 indicate a strong negative correlation, and values around 0 indicate no correlation.
Can I use Spearman's coefficient with non-numeric data?
Yes, as long as you can rank the data, Spearman's coefficient can be applied.
What are the limitations of Spearman's rank correlation?
While versatile, it does not imply causation and can sometimes misrepresent relationships in datasets with outliers.
How does Spearman's coefficient differ from Pearson's coefficient?
Spearman's coefficient assesses rank-based relationships while Pearson's focuses on linear relationships with an assumption of normality.
Is Spearman's correlation sensitive to outliers?
Spearman's correlation is less sensitive to outliers compared to Pearson's correlation, making it a preferred choice for non-normally distributed data.
What types of data can I analyze with Spearman's coefficient?
You can use Spearman's coefficient for ordinal data, continuous data that are not normally distributed, and even for certain types of categorical data.
Can I calculate Spearman's coefficient by hand?
Yes, while it can be tedious, you can calculate it manually using the ranks and the formula provided earlier.
What software can I use to calculate Spearman's coefficient?
Many statistical software packages, like R, Python (Scipy library), SPSS, and Excel, can easily compute Spearman's rank correlation.
Where can I find more resources on Spearman's rank correlation?
Numerous online resources, including academic journals and statistical websites, offer in-depth studies and discussions on Spearman's rank correlation.
Random Reads