Mastering the Upper Quartile: A Comprehensive Guide to Calculation and Applications

-
Quick Links:
- Introduction
- What is the Upper Quartile?
- Importance of the Upper Quartile
- How to Calculate the Upper Quartile
- Step-by-Step Guide to Calculation
- Case Studies and Examples
- Common Mistakes in Calculation
- FAQs
- Conclusion
Introduction
Understanding how to calculate the upper quartile is vital for anyone involved in data analysis, statistics, or research. The upper quartile, or the 75th percentile, represents a critical threshold that helps analysts understand the distribution of data. In this article, we will explore the concept of the upper quartile, its applications, and provide a comprehensive guide on how to calculate it effectively.
What is the Upper Quartile?
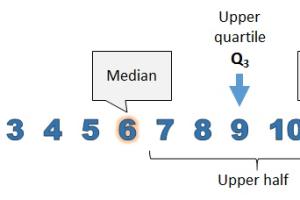
The upper quartile, denoted as Q3, is the value that separates the highest 25% of data points from the rest in a dataset. In simpler terms, it is the median of the upper half of a data set. Understanding Q3 is essential for identifying trends and outliers in data.
Importance of the Upper Quartile
The upper quartile plays a significant role in statistical analysis:
- Data Distribution: It helps in understanding the spread and skewness of data.
- Outlier Detection: Q3 is crucial for identifying outliers that may affect analysis.
- Performance Benchmarking: In business, it can help evaluate high-performing segments.
- Risk Assessment: In finance, it assists in assessing the potential risks of investments.
How to Calculate the Upper Quartile
Calculating the upper quartile can be done using several methods, but the most common approach is as follows:
- Sort the dataset in ascending order.
- Determine the position of the upper quartile using the formula: Q3 = 3 * (n + 1) / 4, where n is the number of data points.
- If the position is a whole number, Q3 is the value at that position. If it's not a whole number, interpolate between the two closest ranks.
Step-by-Step Guide to Calculation
Let’s break down the calculation with a detailed example:
Example Dataset
Consider the following dataset: 12, 15, 14, 10, 20, 30, 25, 18, 22, 28.
Step 1: Sort the Data
Sorted dataset: 10, 12, 14, 15, 18, 20, 22, 25, 28, 30.
Step 2: Calculate the Position for Q3
n = 10 (number of data points)
Q3 position = 3 * (10 + 1) / 4 = 8.25
Step 3: Interpolate Between Values
The 8th position in the sorted dataset is 25, and the 9th position is 28. To find Q3:
Q3 = 25 + 0.25 * (28 - 25) = 25.75
Case Studies and Examples
To further illustrate the use of the upper quartile, let’s look at some real-world applications:
Case Study 1: Educational Performance
A school district analyzes standardized test scores to assess the performance of its students. By calculating the upper quartile, they identify the top-performing students and develop targeted programs to support underperforming students.
Case Study 2: Financial Analysis
An investment firm uses upper quartile calculations to evaluate the performance of its portfolio managers, identifying those who consistently outperform the market.
Common Mistakes in Calculation
Here are some common pitfalls to avoid when calculating the upper quartile:
- Failing to sort the data properly before calculation.
- Misapplying the quartile formula.
- Ignoring interpolation when the position is not a whole number.
FAQs
1. What is the difference between the upper quartile and the median?
The median divides the dataset into two equal halves, while the upper quartile represents the threshold below which 75% of the data falls.
2. Can the upper quartile be affected by outliers?
Yes, extreme values can skew the quartiles, particularly in small datasets.
3. How is the upper quartile used in business?
Businesses use the upper quartile to benchmark performance, identify top sales representatives, and assess market trends.
4. Is it necessary to use interpolation?
Interpolation is essential when the calculated quartile position is not a whole number, ensuring a more accurate representation of the dataset.
5. What tools can I use to calculate quartiles?
Statistical software like R, Python, or Excel can be used to calculate quartiles easily.
6. How does the upper quartile relate to other quartiles?
The upper quartile (Q3) is the third quartile, while Q1 is the first quartile and Q2 is the median.
7. Can I calculate the upper quartile for categorical data?
No, quartiles are used for quantitative data. Categorical data requires different analytical methods.
8. What if my dataset has an even number of values?
For an even number of values, the steps remain the same, but ensure to account for the middle two values when calculating Q3.
9. How often should I calculate the upper quartile?
This depends on your data analysis needs; regular analysis is recommended for ongoing projects.
10. Are there any online calculators for quartiles?
Yes, many online tools can calculate quartiles from input data, making it easier for users.
Conclusion
Calculating the upper quartile is a fundamental skill in statistical analysis that provides valuable insights into data distribution. By mastering the process, analysts can enhance their understanding of datasets and make informed decisions across various fields. Whether it's for academic research, business intelligence, or personal finance, the upper quartile serves as a critical measure that enables deeper analysis and understanding.
For continuous learning, explore additional resources and practice calculating quartiles with different datasets to solidify your understanding.