Data Visualization
Mastering Histogram Creation: A Comprehensive Guide for Beginners
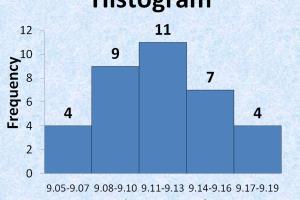
Learn how to draw a histogram step-by-step. Perfect for beginners, this comprehensive guide covers everything you need to create effective histograms. Read More »
Mastering Line Graphs: A Complete Guide to Creating Line Graphs in Microsoft Excel
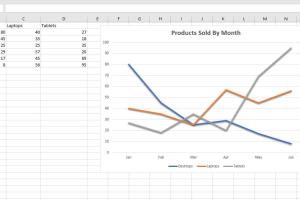
Learn how to create line graphs from data in Microsoft Excel with our comprehensive guide. Step-by-step instructions and expert tips. Read More »
Mastering Box and Whisker Plots: A Comprehensive Guide to Data Visualization
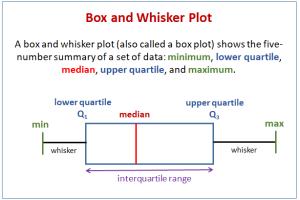
Learn how to create a box and whisker plot with this step-by-step guide. Understand the components, examples, and applications for effective data analysis. Read More »
Mastering Bar Graph Creation: A Comprehensive Guide to Crafting Compelling Visual Data
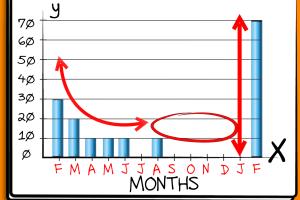
Learn how to create effective bar graphs with our step-by-step guide, tips, and expert insights for clear data visualization. Read More »
Mastering Pie Charts: A Comprehensive Guide to Creating Engaging Visual Data Representations
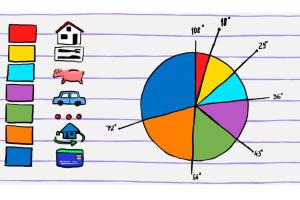
Learn how to make pie charts effortlessly with our in-depth guide. Ideal for beginners and professionals alike! Read More »
Mastering Pie Charts: A Comprehensive Guide to Drawing Them from Percentages
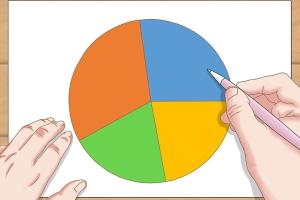
Learn how to draw pie charts from percentages with our step-by-step guide, examples, and expert tips to visualize data effectively. Read More »
Mastering Line Graphs: A Comprehensive Guide to Creating and Interpreting Them
Learn how to make a line graph effortlessly with our detailed guide. Discover tips, tools, and techniques for effective data visualization. Read More »