Data visualization
Mastering Class Width Calculation for Frequency Distribution Tables
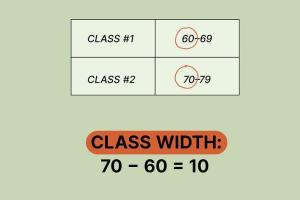
Learn how to find class width for frequency distribution tables with step-by-step guidance and expert insights. Read More »
Mastering Box and Whisker Plots: A Comprehensive Guide to Data Visualization
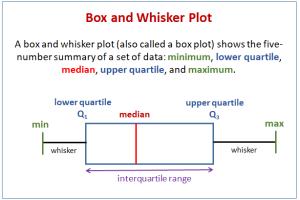
Learn how to create a box and whisker plot with this step-by-step guide. Understand the components, examples, and applications for effective data analysis. Read More »
Mastering Conditional Formatting in Excel: A Complete Step-by-Step Guide
Learn how to apply conditional formatting in Excel with our comprehensive guide. Transform your data visualization skills today! Read More »
Mastering Minitab: A Comprehensive Guide to Statistical Analysis
Unlock the full potential of Minitab with our in-depth guide. Learn statistical analysis techniques step-by-step for better decision-making. Read More »
Mastering Trend Analysis in Excel: A Complete Guide
Learn how to perform trend analysis in Excel effectively with step-by-step guides, case studies, and expert insights. Read More »
Mastering Pivot Tables: A Comprehensive Guide to Adding Data Effectively
Learn how to efficiently add data to pivot tables with our step-by-step guide, expert insights, and practical examples. Read More »
Mastering Excel: 2 Simple Ways to Create Charts with Dual Y Axes
Discover two easy methods to create charts with dual Y axes in Excel. Boost your data visualization skills today! Read More »
Mastering Graph Creation: A Comprehensive Guide to Making Graphs in Microsoft Word
Learn how to make graphs in Microsoft Word easily. Step-by-step guide with tips, examples, and FAQs to enhance your document's presentation. Read More »
Mastering Bar Charts: A Step-by-Step Guide to Creating Bar Charts in Microsoft Word
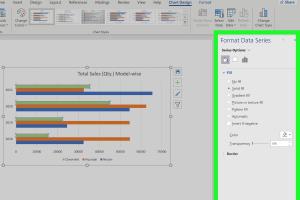
Learn how to create stunning bar charts in Microsoft Word with our comprehensive guide. Step-by-step instructions and expert tips included! Read More »
Mastering Line Graphs: A Comprehensive Guide to Creating and Interpreting Them
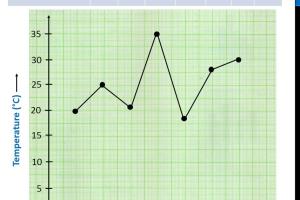
Learn how to make a line graph effortlessly with our detailed guide. Discover tips, tools, and techniques for effective data visualization. Read More »
Mastering Bar Graphs in Excel: A Comprehensive Step-by-Step Guide
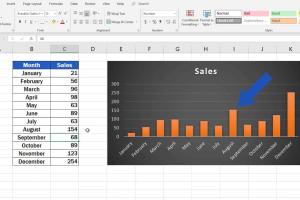
Learn how to create stunning bar graphs in Excel with our step-by-step guide. Perfect for beginners and professionals! Read More »
Mastering Line Graphs: A Complete Guide to Creating Line Graphs in Microsoft Excel
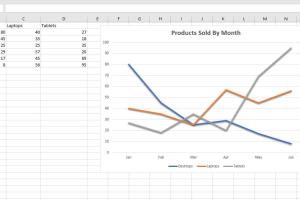
Learn how to create line graphs from data in Microsoft Excel with our comprehensive guide. Step-by-step instructions and expert tips. Read More »
Mastering Excel: Integrate Large Data Sets for Enhanced Analytics
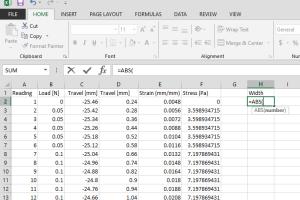
Learn how to seamlessly integrate large data sets in Excel for better analysis and reporting. Step-by-step guides and expert tips included. Read More »
Mastering Histograms: A Comprehensive Guide to Understanding and Analyzing Data Visualizations
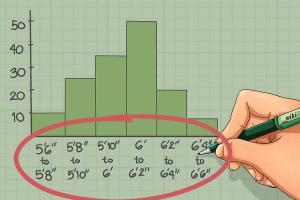
Learn how to read histograms effectively with our in-depth guide. Understand data distributions and enhance your analytical skills. Read More »
Mastering Bar Graph Creation: A Comprehensive Guide to Crafting Compelling Visual Data
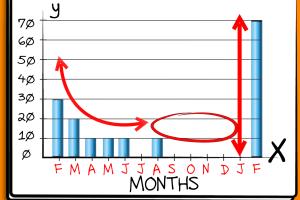
Learn how to create effective bar graphs with our step-by-step guide, tips, and expert insights for clear data visualization. Read More »
Mastering Pie Charts: A Comprehensive Guide to Creating Engaging Visual Data Representations
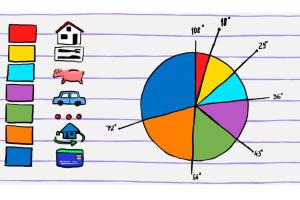
Learn how to make pie charts effortlessly with our in-depth guide. Ideal for beginners and professionals alike! Read More »
Mastering Excel: How to Easily Highlight Every Other Row for Better Data Visualization
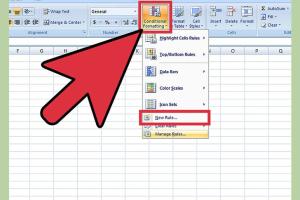
Learn how to highlight every other row in Excel for improved readability and data analysis. Step-by-step guide included! Read More »
Mastering the Art of Converting Excel to PowerPoint: A Comprehensive Guide
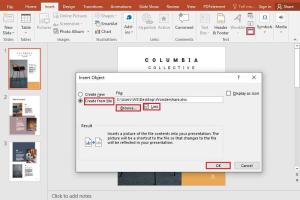
Learn how to convert Excel to PowerPoint seamlessly with our step-by-step guide. Transform your data into engaging presentations effortlessly! Read More »
Mastering Data Visualization: How to Create a Chart in Microsoft Excel
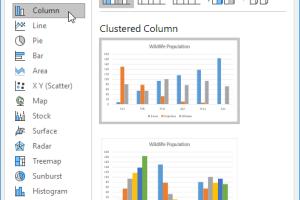
Learn how to create stunning charts in Microsoft Excel with this step-by-step guide. Perfect for beginners and advanced users alike. Read More »
Mastering Pie Charts: A Comprehensive Guide to Creating Pie Charts in Microsoft Excel
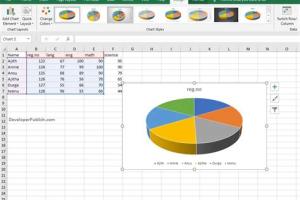
Learn how to create stunning pie charts in Microsoft Excel with our step-by-step guide, tips, and expert insights. Perfect for data visualization! Read More »
Mastering Data Analysis: How to Find the Range of a Data Set

Learn how to find the range of a data set with this comprehensive guide. Step-by-step methods, examples, and expert insights await! Read More »
Mastering Data Analysis with SPSS: A Comprehensive Guide for Beginners
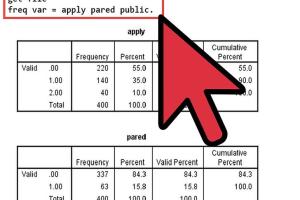
Learn how to analyze data using SPSS with this comprehensive guide, including step-by-step instructions and practical examples. Read More »
Mastering Pivot Tables: A Comprehensive Guide to Adding Filters for Enhanced Data Analysis
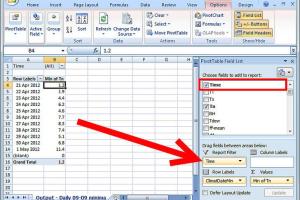
Discover how to add filters to pivot tables effectively for improved data analysis. Step-by-step guide with examples and expert insights. Read More »
Mastering Custom Calculated Fields in Excel Pivot Tables: A Comprehensive Guide
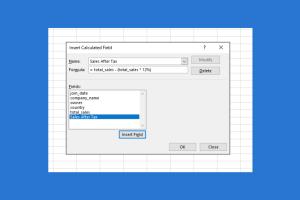
Learn how to add custom calculated fields to Excel pivot tables with this step-by-step guide. Enhance your data analysis skills today! Read More »
Mastering Data Analysis: How to Create Pivot Tables in Microsoft Excel
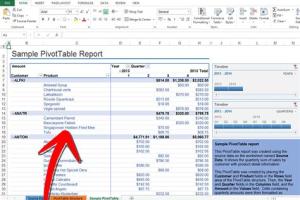
Learn how to create pivot tables in Microsoft Excel for effective data analysis. Step-by-step guide, tips, and real-world examples included. Read More »
Mastering Outliers: Comprehensive Guide to Calculating Outliers in Data Analysis
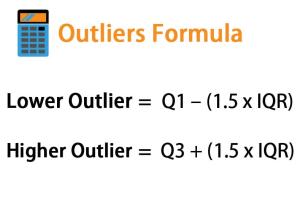
Discover how to identify and calculate outliers in data sets using various methods. Enhance your data analysis skills today! Read More »
Mastering Google Sheets: A Comprehensive Guide to Creating Graphs Effortlessly
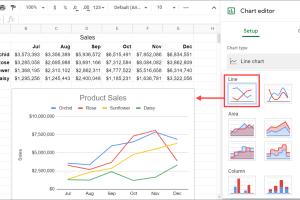
Learn how to create stunning graphs in Google Sheets with our step-by-step guide. Perfect for beginners and advanced users alike! Read More »
Mastering Histogram Creation: A Comprehensive Guide for Beginners
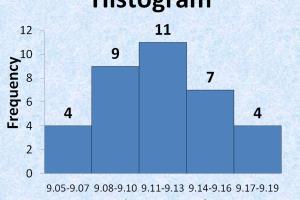
Learn how to draw a histogram step-by-step. Perfect for beginners, this comprehensive guide covers everything you need to create effective histograms. Read More »
Mastering Pie Charts: A Comprehensive Guide to Drawing Them from Percentages

Learn how to draw pie charts from percentages with our step-by-step guide, examples, and expert tips to visualize data effectively. Read More »
Create an S Curve Pattern in Microsoft Excel: A Comprehensive Guide
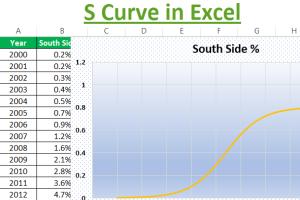
Learn how to create an S Curve pattern in Microsoft Excel with step-by-step guidance, examples, and expert insights. Read More »
Mastering Excel: How to Easily Add a Best Fit Line to Your Data Visualizations

Learn how to add a best fit line in Excel with our step-by-step guide, tips, and examples. Perfect for data analysis and visualization. Read More »
Create Stunning Charts from Pivot Tables: A Comprehensive Guide
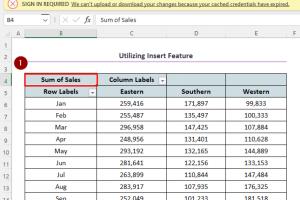
Learn how to create stunning charts from pivot tables efficiently. Step-by-step guide, expert insights, and real-world examples included. Read More »