Mastering Averages in Excel: Step-by-Step Guide for Beginners and Pros

-
Quick Links:
- Introduction to Averages
- Why Averages Matter
- Types of Averages
- Basic Average Formula in Excel
- Advanced Average Functions
- Step-by-Step Guide to Calculate Averages
- Real-World Case Studies
- Expert Insights on Averages
- Common Errors When Calculating Averages
- FAQs
Introduction to Averages
Calculating averages is a fundamental skill in data analysis, particularly when using tools like Microsoft Excel. Averages provide a simple yet powerful way to summarize large datasets, enabling users to glean insights and make informed decisions. This guide will walk you through everything you need to know about calculating averages in Excel, from basic techniques to advanced functions.
Why Averages Matter
Averages help in understanding data trends, comparing datasets, and making predictions. Whether you're a student, a business analyst, or a project manager, knowing how to calculate averages can enhance your analytical capabilities. Averages can also be used in various fields, including finance, marketing, and research.
For instance, businesses often rely on averages to assess performance metrics, such as average sales per employee or average customer satisfaction ratings.
Types of Averages
There are three primary types of averages:
- Mean: The sum of all values divided by the number of values.
- Median: The middle value in a dataset when arranged in ascending or descending order.
- Mode: The value that appears most frequently in a dataset.
Basic Average Formula in Excel
In Excel, the most common function for calculating the mean is the AVERAGE function. The syntax for this function is:
AVERAGE(number1, [number2], ...)Where number1, number2, etc., are the numbers you want to calculate the average for. You can also use cell references or ranges.
Advanced Average Functions
Excel offers several advanced functions to calculate averages based on specific criteria:
- AVERAGEIF: Calculates the average of a range based on a single criterion.
- AVERAGEIFS: Allows for multiple criteria to be specified.
- GEOMEAN: Calculates the geometric mean for a set of numbers.
- HARMEAN: Computes the harmonic mean of a dataset.
Step-by-Step Guide to Calculate Averages
Here’s a detailed guide to calculating averages in Excel:
Step 1: Open Excel and Enter Your Data
Start by opening a new Excel worksheet and enter your data into a single column or row.
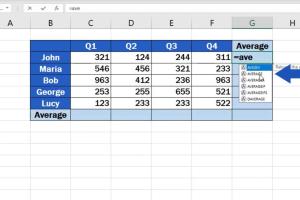
Step 2: Use the AVERAGE Function
Select a new cell where you want the average to appear, and type the following formula:
=AVERAGE(A1:A10)Replace A1:A10 with the actual range of your data.
Step 3: Press Enter
Hit the Enter key, and Excel will calculate the average for the selected range.
Step 4: Using AVERAGEIF and AVERAGEIFS
For conditional averages, use the AVERAGEIF function. For example:
=AVERAGEIF(B1:B10, ">50", A1:A10)This will average all values in A1:A10 where the corresponding value in B1:B10 is greater than 50.
Real-World Case Studies
To illustrate the usefulness of calculating averages in Excel, let’s consider a few case studies:
Case Study 1: Retail Sales Analysis
A retail store manager uses Excel to analyze monthly sales data. By calculating the average sales per product line, they can identify which lines are underperforming and strategize accordingly.
Case Study 2: Academic Performance Evaluation
A teacher tracks student grades over a semester. By calculating the average scores for each student, they can tailor their teaching approach to improve overall performance.
Expert Insights on Averages
According to data analysts, understanding averages is crucial for effective data interpretation. It’s essential to consider the context of the data when calculating averages, as outliers can skew results.
Common Errors When Calculating Averages
Here are some common pitfalls to avoid:
- Ignoring outliers that may affect the average significantly.
- Using the wrong range or cell references in formulas.
- Confusing mean, median, and mode, which can lead to incorrect conclusions.
FAQs
1. What is the difference between mean, median, and mode?
The mean is the average of all values, the median is the middle value, and the mode is the most frequently occurring value in a dataset.
2. How do I find the average of a non-contiguous range?
You can use the AVERAGE function with multiple ranges like this: =AVERAGE(A1, A3, A5).
3. Can I calculate averages in Excel without using formulas?
Yes, you can use the Status Bar in Excel to quickly view the average of selected cells without formulas.
4. How do I handle errors in my average calculations?
Use the IFERROR function to catch errors and display a user-friendly message instead. For example: =IFERROR(AVERAGE(A1:A10), "No valid data").
5. Is there a way to visualize averages in Excel?
Yes, you can create charts like bar graphs or line charts to visualize average data trends.
6. What if my data has blank cells?
The AVERAGE function automatically ignores blank cells in the specified range.
7. How can I automate average calculations for new data entries?
Consider using Excel Tables, which automatically expand the range used in formulas when new data is added.
8. Can I use AVERAGE with text data?
No, the AVERAGE function works only with numeric data. Text values will be ignored.
9. What are some common applications for averages in business?
Averages can be used in sales analysis, customer satisfaction surveys, and performance metrics.
10. Are there any Excel plugins to enhance average calculations?
Yes, several plugins can provide additional statistical analysis tools, enhancing your ability to calculate and visualize averages.
By following this comprehensive guide, you will be well-equipped to calculate averages in Excel effectively, paving the way for more informed decision-making and deeper insights into your data.
Random Reads
- Transfer photos ipod pc
- Transfer vhs tapes to dvd
- Simple solutions for repairing plastic holes
- Ultimate guide to troubleshooting washer not draining
- Ultimate guide to whiten grout
- How to uninstall ubuntu software
- How to uninstall python
- How to upgrade mega ring pokemon x y
- How to update ps4 games
- How to find recover deleted mail iphone